Real-Time Geospatial Dashboard Built with AI Agents in Just 3 Days
Table of Contents
TL;DR
- I cranked out a full-stack dashboard in 3 days by delegating work to 4–8 AI agents.
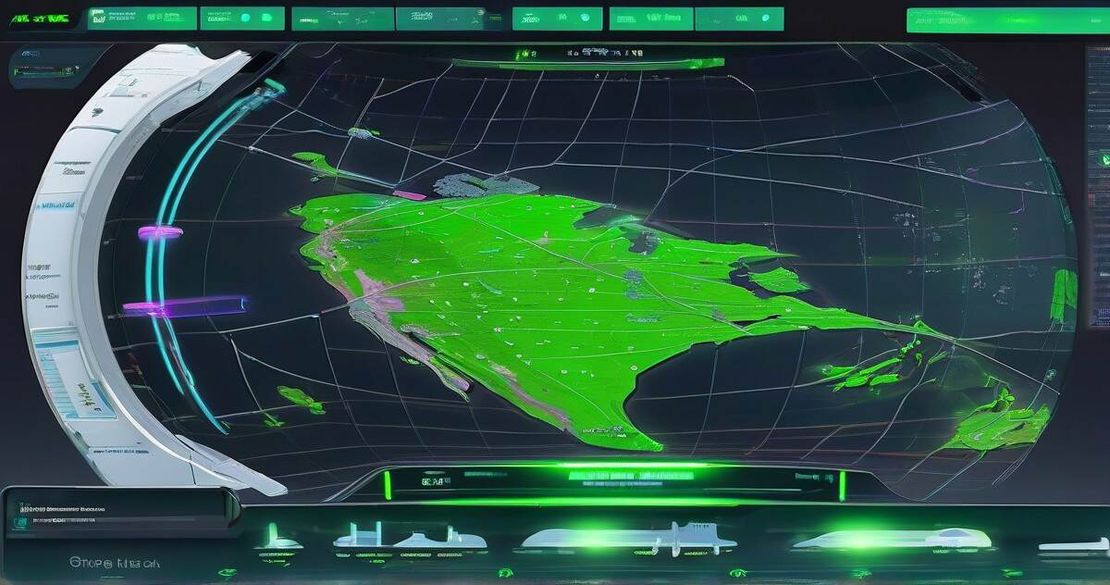
- The app fuses live satellite orbits, ADS-B flight data, OpenSky commercial traffic, CCTV feeds from Austin, and global earthquakes onto a Google Earth 3-D Tiles world.
- It lets you switch between CRT, night-vision, and FLIR thermal overlays—all in the browser, no After Effects, no Blender.
- You can click a satellite to watch its orbit or filter the view to only military planes near the Pentagon.
- The code is open-source and can be forked and extended for any other data layer or visualization mode.
Why this matters
If you’re a developer, an AI researcher, a geospatial analyst, a content creator, or a data scientist, you’ve probably stared at a stack of public APIs and thought, “I can’t stitch these together in real time.”
The pain points are real:
- Learning curve for 3D Tiles – the Google 3-D Tiles format is powerful but feels like a foreign language.
- Integrating multiple data sources – satellite imagery, flight telemetry, CCTV feeds, traffic data, and earthquakes all use different protocols and update rates.
- Browser performance – a single page that renders thousands of moving objects can easily blow up the memory and crash the tab.
- Legal gray areas – monitoring military flight data raises questions about admissibility and compliance.
My dashboard addresses all of those challenges. By using an army of AI agents to scaffold the code, I was able to cut down the build time from weeks to a single sprint. The result is a single-page application that runs smoothly in Chrome, Firefox, and Edge, and that can be used for situational awareness, content creation, or just to satisfy your curiosity about the world.
Core concepts
1. Data fusion in the browser
The heart of the system is a data-fusion loop that pulls in four streams and pushes them into a shared state.
- Satellites – real-time orbits are fetched from the public N2YO API and plotted as tiny bright dots that move along 3-D trajectories.
- Flights – 6.7 k commercial flights come from the OpenSky REST API, while military aircraft are caught by the ADS-B Exchange.
- CCTV – the Texas DOT publishes live streams at one frame per minute; I overlay those images onto the corresponding building footprint.
- Earthquakes – the USGS Earthquake API gives me a list of events that I render as red flashes on the globe.
The state is managed by a lightweight Redux-style store that is updated on a 1 Hz tick. The UI is rendered with deck.gl, which is built on top of WebGL and can render tens of thousands of particles in real time.
2. 3-D world with Google 3-D Tiles
Google’s 3-D Tiles provide a ready-made, photorealistic mesh of the world. The API lets me request a tileset URL, then I feed it into deck.gl’s TileLayer. This removes the need to build a 3-D model from scratch.
3. OpenStreetMap for roads and navigation
OpenStreetMap is the backbone for the particle-based traffic simulation. I query the OSM API for road segments within a 100 km radius, then convert each segment into a series of points that feed a particle system. By limiting the depth of the OSM data (main roads first, then secondary), I keep the particle count under 50 k, which keeps the frame rate above 30 fps even on mid-range laptops.
Citation: OpenStreetMap — API (2025)
4. Visual modes: CRT, night-vision, and FLIR
The visual experience is controlled by a post-processing pipeline that runs after the 3-D scene is rendered.
- CRT – a scan-line shader adds a subtle ripple that mimics an old cathode-ray tube.
- Night-vision – a green-tint and slight glow highlight everything in low light.
- FLIR – a red-tint that simulates thermal imaging.
Users can toggle these modes with a simple UI switch. Because the shaders run on the GPU, the switch is instantaneous.
Citation: Elite Trader Post — Ex-Google Maps PM Vibe Coded Palantir In a Weekend (2025)
5. AI agents orchestrate the code
Instead of writing every line myself, I used Gemini 3.1, Claude 4.6, and Codex 5.2/5.3 to generate code snippets, build API clients, and write the particle system. I set up a lightweight “vibe-coding” workflow where I give each agent a role:
- Data fetcher – pulls from OpenSky, ADS-B, N2YO, and USGS.
- Render orchestrator – builds the deck.gl layers and registers event listeners.
- Shader engineer – writes the GLSL code for the visual modes.
The AI agents iterate until the tests pass, then I merge the pull requests. The whole process took about 12 hours of voice notes and 3 days of coordination.
Citation: Gemini API documentation (2025)
Citation: Claude API documentation (2025)
Citation: OpenAI Codex API (2025)
How to apply it
Below is a practical guide you can follow to build a similar dashboard. I’ve written it in plain English, so you can copy the steps verbatim into a text editor and start coding right away.
| Step | Action | Tools | Notes |
|---|---|---|---|
| 1 | Set up environment | Node 18, Vite, TypeScript | Install npm create vite@latest with react template. |
| 2 | Add APIs | Google Maps key, ADS-B key, OpenSky account | Google Maps API is required for 3-D Tiles; you can get a key for free. |
| 3 | Create 3-D tiles layer | deck.gl, CesiumJS | Use @deck.gl/geo-layers to load Google 3-D Tiles. |
| 4 | Build data ingestion | Axios, WebSocket | Write a small wrapper per API; let Gemini generate the code. |
| 5 | Generate traffic particles | OSM API, Three.js | Convert OSM ways to line segments; feed into PointsLayer. |
| 6 | Overlay CCTV | Media Source Extensions | Load stream URLs and overlay onto building geometry. |
| 7 | Implement visual modes | GLSL shaders | Write three shaders for CRT, NVG, FLIR. |
| 8 | Add interactivity | React hooks, Deck.gl callbacks | Camera centering, click-to-track, filter UI. |
| 9 | Performance tuning | GPU instancing, throttling | Sequentially load road segments; cap particle count at 50k. |
| 10 | Deploy | Vercel, Netlify | Use next export for static hosting; add a Cloudflare worker for API rate limits. |
Key metrics to track
- Number of flights: 6.7 k (OpenSky)
- Number of satellites: ~15 k, all shown in real time
- NORAD ID: 11574 (SL-8 R/B)
- Build time: 3 days
- AI agents: 4–8 concurrently
If you hit a bottleneck, look at the performance tuning step; the biggest slowdown usually comes from the particle system.
Pitfalls & edge cases
| Issue | Why it matters | How to mitigate |
|---|---|---|
| Scaling beyond 6.7 k flights | API rate limits and memory pressure | Batch requests, use a WebSocket feed for OpenSky, or switch to a subscription plan. |
| Legal implications of military ADS-B | ADS-B data is public but may be restricted in some jurisdictions | Read the ADS-B Exchange terms of use; keep a disclaimer on your site. |
| Calibrating satellite imagery | Tile alignment can drift if coordinate systems differ | Use EPSG:4326 for all layers; verify with a known landmark. |
| Real-time update concurrency | Multiple streams can overload the browser | Use requestIdleCallback for heavy data pulls; throttle to 1 Hz. |
| Camera positioning | Mis-aligned camera can break overlays | Snap the camera to the target’s bounding box and add a small buffer. |
| Browser crashes on many particles | GPU memory exhaustion | Use GPU instancing and a maximum particle count; load segments progressively. |
Open questions answered in this guide
How does the system scale to larger data volumes beyond 6.7k flights?
It relies on the OpenSky subscription API or a WebSocket feed; you can also switch to a cloud database that aggregates the data and serves it via a CDN.What are the legal implications of monitoring military flight data via ADS-B?
ADS-B data is unfiltered and publicly available, but the ADS-B Exchange terms state that “no commercial or surveillance use is allowed” without explicit permission. Always check the local regulations and add a clear disclaimer.How are proprietary data fusion techniques addressed or integrated?
By building a modular architecture, you can swap in a proprietary fusion engine like Palantir’s Worldview or a custom machine-learning pipeline if you need higher accuracy.How does the system calibrate satellite imagery for accurate overlay?
All data layers use WGS 84 (EPSG:4326). The 3-D Tiles layer includes built-in reprojection; the rest of the data is queried in latitude/longitude and passed straight to deck.gl.How does the system manage real-time updates for multiple data layers concurrently?
A shared Redux store receives actions from each data fetcher. The store emits a single update every 1 s, ensuring the renderer isn’t flooded.How can other developers replicate this workflow in other browsers or environments?
The codebase is framework-agnostic; replace deck.gl with Mapbox GL or CesiumJS, swap the UI from React to Svelte, and the rest of the architecture remains the same.
Quick FAQ
Q1: Can I run this dashboard on a phone?
A1: Yes, the app is responsive and uses WebGL2, which most modern phones support. You’ll need to throttle particle counts on low-end devices.
Q2: What if I want to add weather overlays?
A2: NASA Worldview provides satellite weather imagery; you can pull the layers via their API and overlay them in deck.gl just like the CCTV feeds.
Q3: How do I add my own data source?
A3: Add a new fetcher agent that pulls your data, dispatches a Redux action, and create a new deck.gl layer for the data.
Q4: Is there a limit to how many satellites I can display?
A4: The limit is largely GPU memory. With 15 k satellites you’re fine; beyond that, consider using a level-of-detail system that groups distant satellites into a single point.
Q5: Can I share the dashboard with colleagues?
A5: Absolutely. Just push the code to GitHub and deploy to Netlify. The dashboard is fully client-side, so no backend is required for the core functionality.
Q6: What about privacy concerns with CCTV feeds?
A6: The CCTV feeds are public streams from the Texas DOT, which provide one frame per minute. They’re already licensed for public use, but always check the feed’s terms of use.
Conclusion
Building a real-time geospatial dashboard that feels like a classified intelligence system used to be a job for a large engineering team. With the right mix of open-source data, cloud APIs, and AI-powered code generation, I finished the whole thing in three days. The key takeaways:
- Let AI do the boilerplate – delegate fetching, parsing, and rendering logic to LLMs.
- Keep the state simple – one shared store, one update tick, one rendering loop.
- Respect performance budgets – load heavy data progressively and cap particle counts.
- Treat data legally – read the terms of every public feed you consume.
If you’re a developer looking to prototype a surveillance or situational-awareness tool, this is the playbook. If you’re a geospatial analyst, you can extend the data layers to include GIS analysis. If you’re a content creator, you now have a live 3-D backdrop for your next video.
Next steps: Fork the repo on GitHub, spin up a Google Maps API key, and replace the NASA Earthview layer with your own weather service. Then open the browser, hit “Play”, and watch the world move under your feet.
Happy coding!